ECS 145 Term Project
Due Date
March 17, 11:59 pm. Tip: Act as if
the due date is one day before the real one.
Overview
You are all familiar with the idea of a histogram. It's designed
to show which values of a variable are more frequent and which occur
less often.
For instance, R has a number of built-in datasets, one of which is
Nile, the height of the Nile river over a multi-year period.
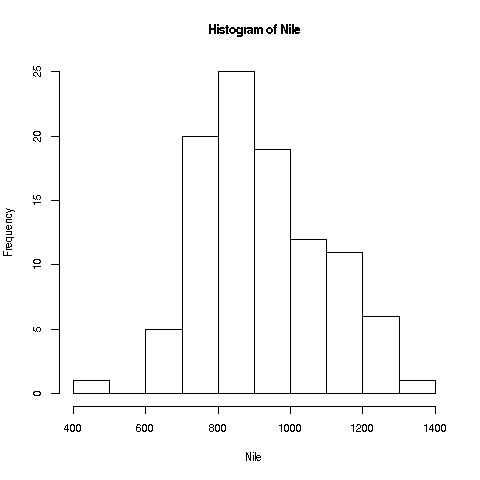
Typing
> hist(Nile)
produces this picture:

We see that the most common values seem to be in the 800s, with some
rare values in the 400s and 1400s, and so on.
A major issue, though, is the number of bins, controlled by the argument
breaks in hist(). If we have too few bins, the bins
become very wide and we lose details. In the extreme, we have just 1
bin, totally noninormative. But if we have too many bins, we have too
few data points falling in each bin, and those small sample sizes give
us unreliable bin counts; the appearance of the histogram then becomes
very choppy.
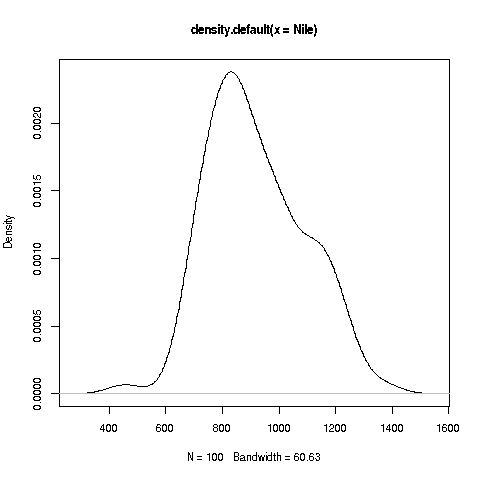
A more advanced alternative to a histogram is a kernel density
estimator. Instead of just counting data points in a bin, points
outside the bin are counted too, just with small weights. Actually, we
don't really have bins, but the details won't concern us here. The key
points are that (a) this method yields a smooth curve, which many
consider more appealing, and (b) there is still an argument, bw,
that controls the "wiggliness" of the curve.

The arguments breaks or bw are called tuning
parameters or hyperparameters. They give the user control
over some aspect of an algorithm.
The goal of this project is to produce an R package that helps a user
explore the effects of setting different values of breaks or
bw. The nature of the exploration will be that the user will be
repeatedly asked whether she wishes to change the current value of the
tuning parameter, zoom in/out, etc. After exploration, the code will
save some of the graphs that the user has found useful.
Details
- BEFORE EMBARKING ON THIS PROJECT, experiment with a few
different values of breaks and bw, to get a feel for how
these work.
- You will develop a function with call form
exploreShape(x,estMethod,tuning,twoAtATime)
where the arguments are as follows:
- x: A numeric vector to be graphed.
- estMethod: Either 'hist' or 'density'.
- tuning: The intial value of either breaks or
bw.
- twoAtATime: If TRUE, always display the current graph
superimposed on the previous one, to aid comparison.
- The code will repeatedly loop around, giving the user the following
choices:
- Give a new value of the tuning parameter.
- Zoom in/out, the former meaning to redo the graph over a more
narrow range of values of x.
- Run an animation, consisting of the graph as the tuning
parameter is varied in small increments from the choppiest/wiggliest
to the smoothest.
- Quit. The user will then be asked to specify some values of the
tuning parameter for which the code will save the graphs, in forms
that they can later be plotted by calling plot().
- The return value of the function will be an S3 object of class
'densEst'. It will include enough information to support
generic functions print(), summary() and
plot().
The latter will plot all the saved plots. You can do this one at a
time, with keyboard Enter meaning "go to the next plot," or plot them in
a lattice format.
- You may (but NEED NOT) use external R packages from
CRAN, but only if they are
easily installed on your CSIF account. You must give the exact code to
download and install the package in your own R library directory.
-
You may place mild restictions on the user, e.g. maximum number of
graphs formed.
- Of course, your report should have example sessions, showing the
user's input and the graphs that resulted.
Note carefully!
Important Rules
PLEASE FOLLOW THESE RULES 100%!
- You must use LaTeX and R throughout.
- Submit your report, including all files, i.e. .tex,
.pdf, R code (see below), any image files, etc., to my
handin site on CSIF (NOT the TA's site), directory
145project.
- Your LaTeX file must be named ProjectReport.tex, and the
corresponding PDF ProjectReport.pdf. The grading script will
look for these; don't disappoint the grading script!
- The name of your submitted file must
be of the form email1.email2....tar , where each
emaili is the UCD e-mail address of group
member i, e.g. bclinton.gwbush.bobama.dtrump.tar.
Note the periods separating fields. Don't get the address wrong!
Otherwise the grading script may not give someone credit.
- Your .tar file must contain only regular files, NO
SUBDIRECTORIES!!!! And .tar does NOT mean .tar.gz or
.tar.bz2 (or for that matter .rar, which one student used
once). The grading script will execute
tar xf youraddresses.tar
ls ProjectReport.tex
xpdf ProjectReport.pdf
Note that it will NOT do cd! If you have subdirectories, the
script will report to me that you have no .tex files etc.
- Place all your code in a file TermProject.R, as well
as in an Appendix to your report (LaTeX \appendix \section{}).
I may execute your code, so make sure it is runnable.
- Absolutely NO late reports will be accepted. As you near the
deadline, keep submitting what you have (each one will overwrite
the last), so that at least you will get a lot of credit even if you
don't finish.
- Include a section listing each team member's contribution to
the project -- who did what. If a member did not participate, do
not include him/her in this section, nor in the .tar file name.
Don't forget this section!
- DOUBLE-CHECK THAT YOU ARE MEETING ALL SPECS! Whoever does
the actual turning in of your submission, impress upon him/her that this
is a huge responsiblity that can affect everyone's grade.
- Do a good, professional-quality job!
General commnets:
- Groups that put in a reasonable amount of time -- and thought! --
almost always receive at least a B+ grade on the project, typically
better. Groups that do not complete the project usually get a D
grade. PLEASE START EARLY!
- As explained in class, groups that do good work on the project
receive an extra bonus in their course grades, beyond what your quiz
and homework grades are. The boost is usually at least one
notch (e.g. B to B+) and often two notches (e.g. B to A-). E.g. a
student could have strictly B work in the homework and quizzes and
yet still get an A- in the course.
- A+ grades are very possible, and can have a significant impact
on your course grade, letters of recommendation, knighthoods,
marriage prospects, coronations, etc.
Criteria:
- Technical content of the work (correctness, thoroughness etc.).
- Adherence to instructions.
- Professional quality of the work: Clear, engaging writing,
using correct grammar; it need not (should not) be pretentious, but
avoid being too colloquial ("the mean was kinda low"). Presentation
need not be fancy, but graphs and tables should be used when helpful.

